



How to Query PostHog With AI and Check the Result
Query PostHog event data through Leina in chat, avoid common metric pitfalls, and check daily values, time boundaries, and period totals against the source data.
Asking an AI agent in team chat to “chart our new feature usage this week” sounds simple. But analytics queries are prone to subtle errors: mixing up total event clicks with unique active users, bucketing days in UTC instead of your team’s local timezone, or treating half of today’s incomplete data as a sudden “usage drop.”
With Leina, you can query PostHog analytics directly from Slack or team chat. To make the output trustworthy, ask for the underlying daily data alongside the visual chart, and compare the result against your PostHog dashboard before dropping the results into a presentation or weekly review.
Start with an event your team already uses in a report, so you have a source comparison ready.
Define the metric parameters before querying
Vague requests like “How much was this feature used?” lead to ambiguous charts. Before prompting, define these essential query parameters:
| Parameter | What to specify | Why it matters |
|---|---|---|
| Project | Connected PostHog project name | Identifies the data source; production and staging may also need separate filters. |
| Event name | Exact event identifier (e.g. billing_upgrade_clicked) | Avoids querying deprecated or misspelled custom events. |
| Measure | Total occurrences vs. Unique users | Occurrences measure event volume; unique users count people who triggered it. Whether that indicates adoption depends on the event. |
| Date range & Timezone | Explicit start/end timestamps and a reporting timezone (e.g. America/Los_Angeles) | Prevents events near midnight from shifting into adjacent days. |
| Filters | Environment, test accounts, or specific user properties | Defines which records to include; use filters that match your actual event properties. |
| Partial days | Exclude today or flag it as incomplete | Prevents an incomplete day from looking like an alarming drop. |
Ask for tabular values alongside the visual chart
When querying in chat, always ask for both a daily summary table and a chart. A visual chart is easy to share, but a data table is what allows you to verify the math.
Copy and adapt this prompt in your connected chat:
In our connected PostHog project
[project], calculate the [total occurrences / unique users] of[event_name]from[start timestamp]through[end timestamp].
- Timezone: Use
[timezone]for daily boundaries.- Filters: Apply
[e.g. environment = production, exclude internal staff].- Format: Return both a daily data table and a visual bar chart.
- Metadata: State the project, measure, reporting window, exact filters, and retrieval timestamp. Include the query or source link if available; otherwise provide the conditions I can reproduce.
- Partial dates: Mark dates that are not yet complete in the reporting timezone.
- Retrieval gaps: Report missing or incomplete data separately from confirmed zero counts.
Only perform read operations.
Connect an account that can read the target PostHog project through Connections. If you use Slack, the Slack guide covers the chat setup. PostHog’s insight guide explains which analysis types fit different questions.
Check one date, then the full window
Before pasting the chart into an executive update, verify the numbers against PostHog with these two checks:
1. Spot-check one completed date in PostHog
Open PostHog Insights in your browser, configure the same event and filters for a single completed day (like last Wednesday), and compare the count with the agent’s table. A match is a useful first check. It does not validate the whole query: different filters can produce the same count on one day. Compare the full reporting window next, including records near the start and end boundaries, and confirm that both queries use the same project, measure, timezone, and filters.
2. Verify total vs. unique user math
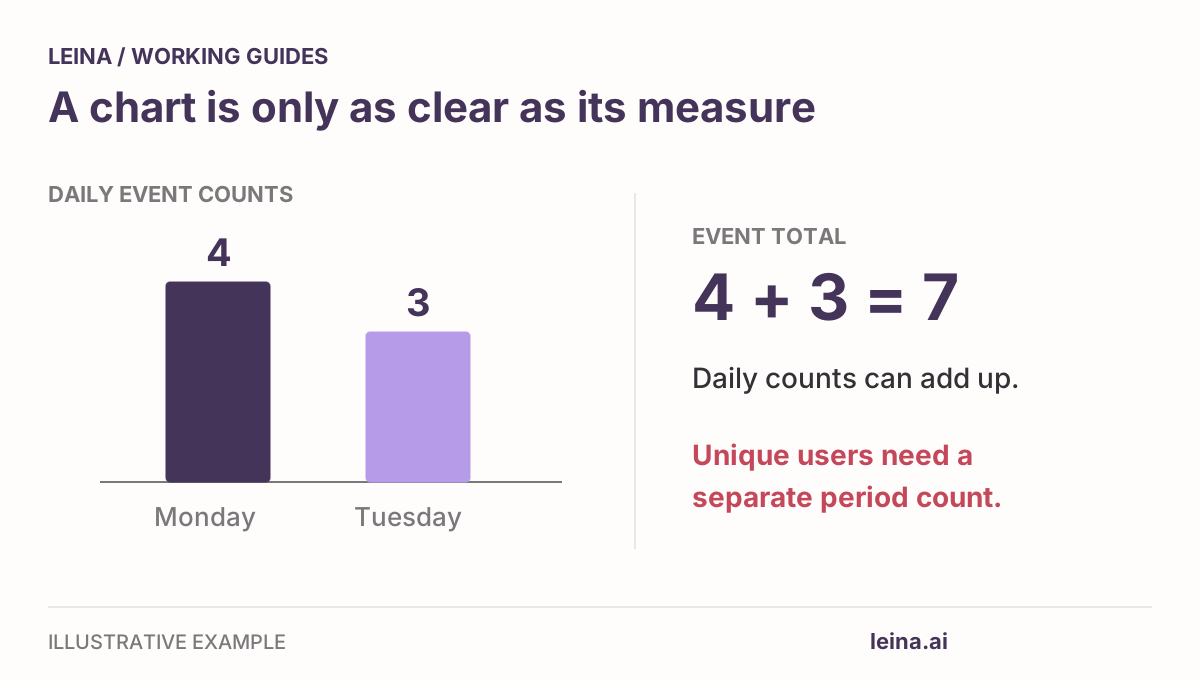
- Total occurrences are additive: If you queried total event volume, daily rows covering the full window without overlap should sum to the period total when both queries use the same scope and underlying data.
- Unique users are not additive: A user active on both Monday and Tuesday counts once in Monday’s daily bucket and once in Tuesday’s daily bucket, but only once in the multi-day total.
The following values are illustrative:
| Day | Event occurrences (Additive) | Distinct users (Non-additive) |
|---|---|---|
| Monday | 4 events | 2 users (Alice, Bob) |
| Tuesday | 3 events | 2 users (Alice, Charlie) |
| Two-day total | 7 events (4 + 3) | 3 users (Alice, Bob, Charlie) |
If an agent reports a multi-day unique user total by simply adding daily unique user counts together, the calculation is flawed.
Quick troubleshooting for mismatched numbers
When the numbers in chat don’t match what you see in the PostHog UI, use these checks to narrow down the difference:
| Symptom | Root cause to check |
|---|---|
| All daily counts are consistently lower | Check if internal team filtering or bot exclusions are enabled in PostHog but omitted in the query (or vice versa). |
| Spikes and valleys shifted by one day | Compare the timezone and day boundaries used by each query. |
| A steep drop on the final day | Check whether the day was complete when the query ran. If it was, investigate the change rather than assuming partial data. |
| Missing dates in the middle of the range | Check whether the source confirms zero events or the query returned incomplete data. |
| Historical numbers shifted compared to last week | Check for late-arriving events, backfills, or changes to filters and source records. |
You can use the PostHog chart review worksheet to record your query parameters and resolution notes.
Keep observed metrics separate from hypotheses
For example, using fictional numbers, a report might separate these statements:
- Observed change: “Checkout button clicks increased by 34% from Monday to Thursday.”
- Hypothesis: “Tuesday’s v2.4 mobile app release may be related. Compare affected users with other segments and check for tracking changes; that comparison alone would not establish causality.”
Once the query is checked, you can ask Leina to run it on a schedule. Specify the timezone and delivery location, then review the first scheduled result. Recheck the query when instrumentation or filters change; recurring execution does not replace verification.
PostHog also offers its own AI analysis capabilities. Choose the workflow that fits where your team works, and keep the source conditions with any chart you share.